


Hey,
Here is a problem that does not exist with traditional products.
Your feature is running fine. Requests come in, responses go out.
No errors. No alerts. The infrastructure dashboard is green.
And yet your AI has been giving users wrong information for two weeks.
With a normal software bug, the system fails loudly. A button stops working. An API returns a 500 error. Something turns red and someone gets paged.
With an LLM, nothing breaks. The system keeps responding. The response time is normal. The HTTP status is 200.
The answer is just wrong.
A support chatbot starts making up refund policies that do not exist. A search tool starts returning results that sound correct but are not. An escalation bot stops flagging edge cases and starts resolving them with invented answers.
No dashboard alerts. Nobody notices. Until a user complains. Weeks later.
This is the problem that LLM observability exists to solve.
Why Your Existing Monitoring Is Not Enough
Every engineering team already monitors their software. Response times, error rates, uptime. This is standard.
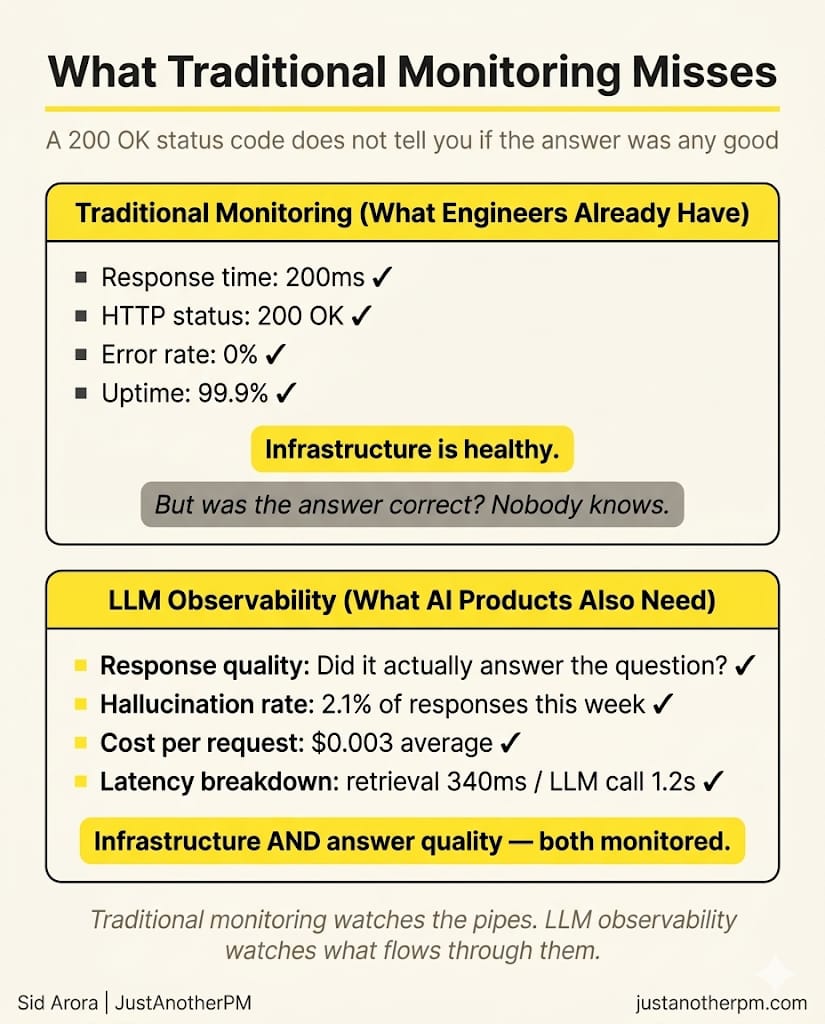
When you add an LLM to your product, all of that still matters. But it only tells you one thing: did the system respond?
It does not tell you whether the response was any good.
A request can successfully respond in 400 milliseconds and contain a completely inaccurate answer. Your monitoring will show everything is healthy. Your user just got wrong information.
Traditional monitoring watches the infrastructure. LLM observability watches what the model is actually producing.
You need both.
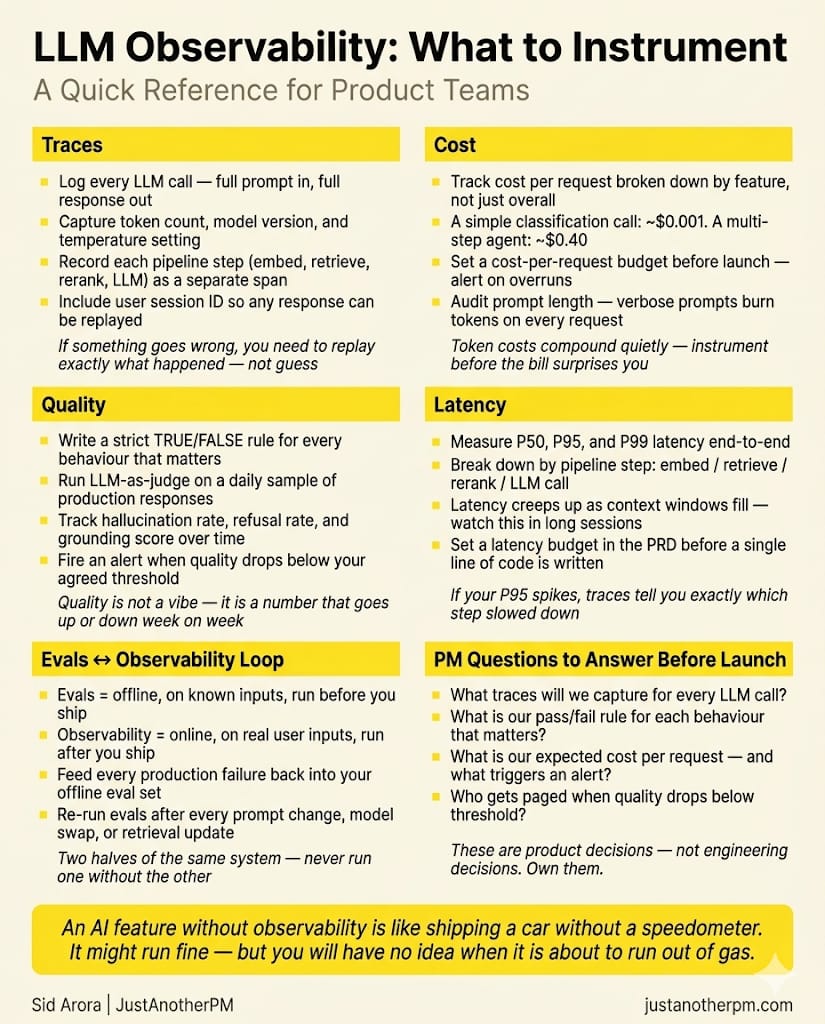
The Three Things to Measure
LLM observability covers three things that traditional monitoring does not touch.
Quality. Is the model giving correct answers? Is it grounded in the right information? Is it following your instructions?
Quality is hard to measure because there is no status code for "this answer was wrong." But it is the most important thing to track, because quality degradation is what users actually experience.
Cost. LLMs charge per token. Every single request costs money.
A RAG pipeline retrieving too many chunks, a prompt that has grown verbose over time, a feature being called more often than expected — all of these show up as cost increases before anything else signals a problem.
Latency. LLMs are slow compared to most APIs. A two-second response might be fine for a document summary tool and completely unacceptable for a live support chat.
Latency also tends to increase over time as prompts grow and pipelines get more complex.
What is a Trace?
The most important concept in LLM observability is the trace.
A trace is a complete record of everything that happened during a single user request from the moment the user sent their message to the moment they got a response.
For a simple chatbot, this is easy. User message in, model response out. One step.
But most AI systems in production are not one step. They are pipelines.
Take a RAG-powered support bot. For a single user message, it might do all of this:
1. Convert the user's question into a vector
2. Search the knowledge base for matching documents
3. Retrieve the most relevant chunks
4. Re-rank them
5. Build a prompt with the best context
6. Call the LLM
7. Stream the response back
That is seven steps. Each one has its own latency, its own cost, and its own way of going wrong.
A trace captures all seven. It records the input and output at each step, how long each took, how many tokens were used, and how everything connected together.
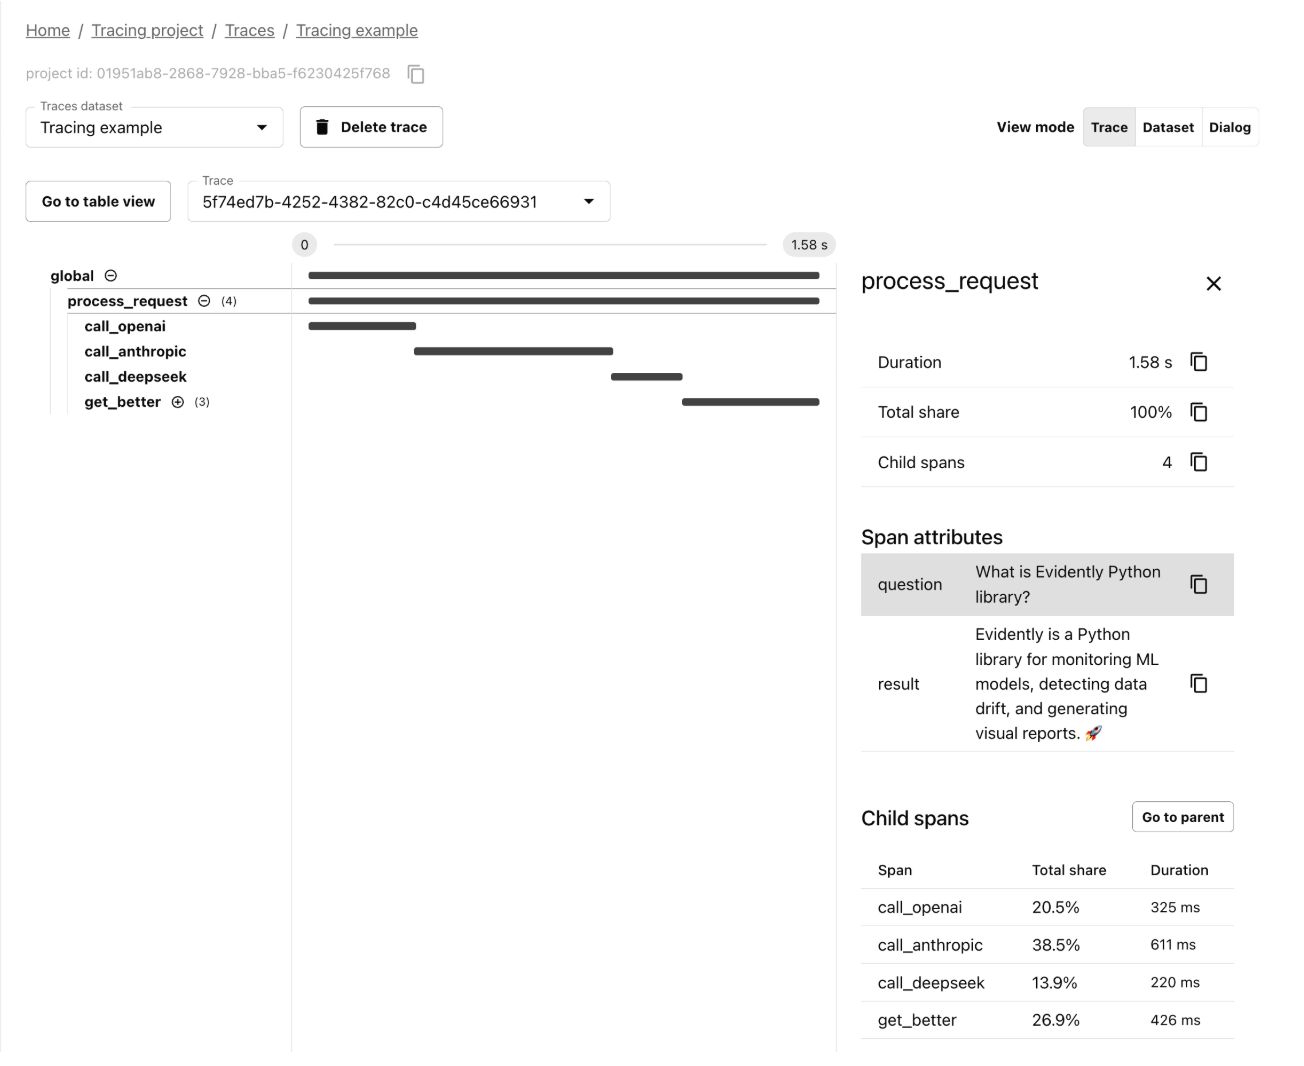
Each individual step inside a trace is called a span. The trace is the full request. The spans are the steps within it.
This idea comes from how engineers already debug microservices. It is the same concept, applied to AI pipelines. The difference is that LLM spans also capture things like the exact prompt that went in, the exact response that came out, the model version, and the token count.
When something goes wrong, you can go back and replay exactly what happened.
How Teams Measure Quality at Scale
Counting tokens is easy. Figuring out whether an answer was good is not.
If your system handles a thousand conversations a day, you cannot read them all. You need a way to score quality automatically.
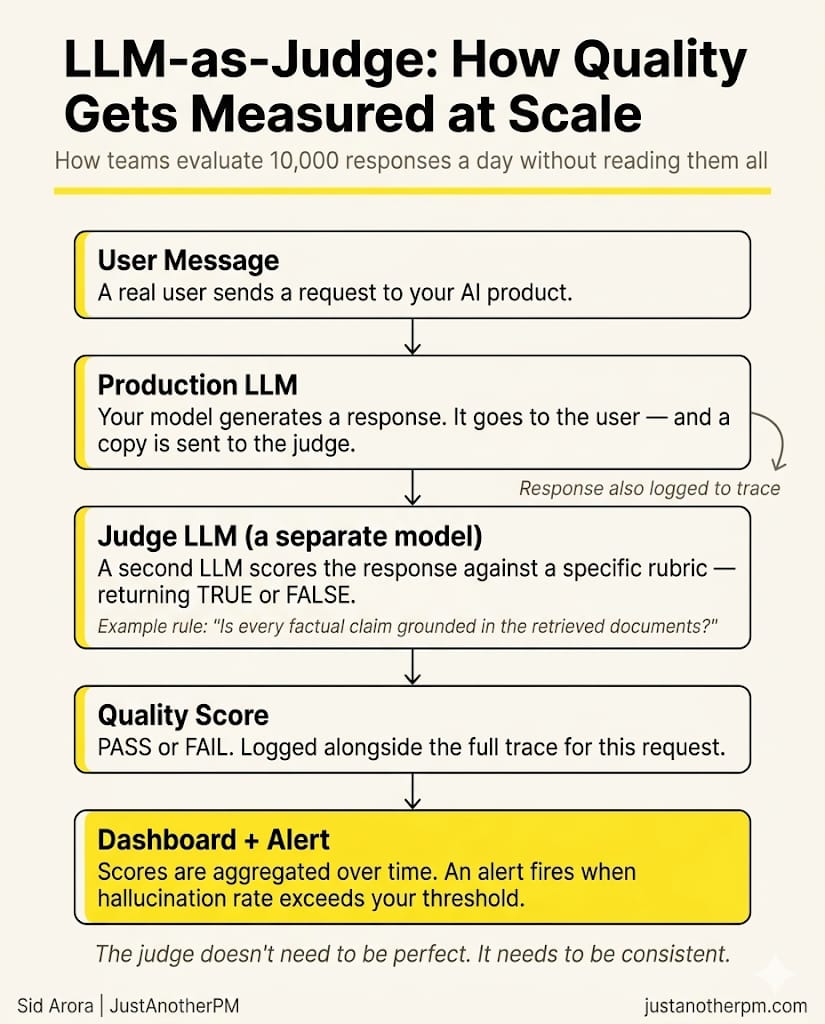
The solution the industry has settled on is called LLM-as-judge.
Here is how it works. For every response your system produces, a second LLM (which is the judge) scores it against a specific rule. The rule is always a TRUE or FALSE question:
- Did the response answer the user's actual question? (TRUE or FALSE)
- Is every factual claim grounded in the documents that were retrieved? (TRUE or FALSE)
- Did the assistant escalate when it was supposed to, instead of guessing? (TRUE or FALSE)
The judge reads the conversation, applies the rule, and outputs a score.
The judge does not need to be the most powerful model. It needs to be consistent. If it agrees with human reviewers most of the time and produces the same score for the same input, it is good enough.
This is what makes it scalable. Instead of someone reading 50 conversations a week, you can score thousands of responses every day automatically.
LLM-as-judge is not perfect. Judge models tend to prefer longer responses, and they can miss subtle errors that a domain expert would catch. They are most reliable for obvious failures like hallucinations, off-topic responses, missing escalations.
The right way to think about it: the judge is a smoke alarm. It tells you something needs attention. A human still goes and investigates.
Liking this post? Get the next one in your inbox!
What Good Instrumentation Gives You
When observability is set up properly, a few things become possible that were not before.
You can look up any conversation from any point in time and see every step that produced it. When a user says "the bot gave me wrong information last Tuesday," you are not guessing what happened. You are reading the exact trace.
You can track quality as a metric over time. Not "that response seemed fine" but "our hallucination rate last week was 3.2%, up from 1.8% the week before." That kind of trend is invisible without systematic measurement.
You can see cost broken down by feature. A simple classification call might cost $0.001. A multi-step agent might cost $0.40. Knowing this at the feature level tells you where to focus optimisation, and helps you build accurate cost models before usage scales.
You can set alerts on things that matter. When hallucination rate crosses a threshold, when P95 latency spikes, when refusal rates jump unexpectedly — your team gets notified before users start complaining.
The Tools
A small set of tools has emerged specifically for LLM observability.
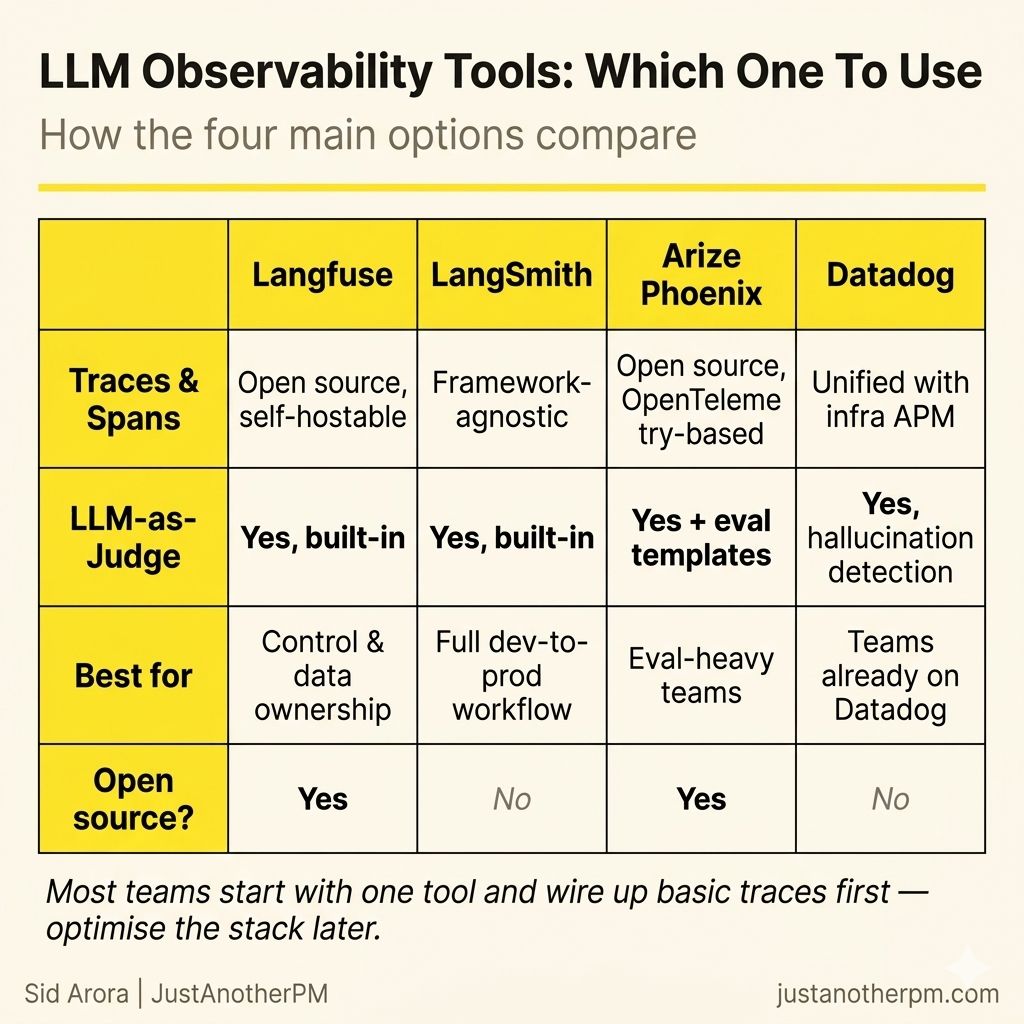
Langfuse is open source and self-hostable. It supports traces, LLM-as-judge scoring, and prompt management, and works with any model. Teams that want full control over their data tend to start here.
LangSmith is from the LangChain team but works with any framework. It covers tracing, evaluation, prompt versioning, and deployment in one place.
Arize Phoenix is open source and built on OpenTelemetry. It is a strong choice for teams that run systematic offline evals alongside production monitoring.
Datadog LLM Observability sits on top of Datadog's existing infrastructure monitoring. If your team already uses Datadog, this gives you AI and infrastructure in one dashboard.
Most teams pick one tool, start with basic traces, and expand from there.
How This Connects to Evals
If you have built evals before, observability will feel familiar. They are two halves of the same idea.
Evals are offline. You run a test set before you ship. You check whether the system behaves correctly on inputs you already know.
Observability is online. You monitor real user interactions after you ship. You check whether the system behaves correctly on inputs you did not anticipate.
The eval set you built before launch becomes your baseline. Observability tells you whether production is holding to that baseline — or drifting from it.
When production surfaces a failure your evals did not catch, that failure becomes a new test case. You add it to the set, run it in future evals, and the system gets better.
This is why the best AI teams treat evals and observability as one loop, not two separate things.
Define what good looks like before you ship. Measure it after you ship. Use what you find in production to improve your test set. Repeat.
Shipping the feature is not the end. It is where the work of keeping it good actually starts.
More from
Product Management Concepts


